Reply To:
Name - Reply Comment

 End of the COVID-19 pandemic? When? The responses map itself somewhere within a range from at least one year to 10 years plus. Wide agreement: it is something here to stay. There is no way out. Better get used to the ‘new normalcy’.
On the first looks, this thinking appears rational. It is exactly what to expect, from a population that has been seeing only the first part of the growing exponential ‘S’ curve for more than six months. One sees nothing but escalation. A turning point might appear at some point. Then the curve might take a U-turn. Mathematical extrapolation is possible only when the curve does so. Till the end of June we were nowhere near.
On the other hand, we know pandemics cannot go on forever. From the beginning of the mankind, all pandemics, some far disastrous than COVID-19, for example plague and cholera, multiple times subdued with time. With that knowledge, we can safely assume COVID-19 will certainly be over one day. Question is when that day would be.

For that, we have to first define the ‘end’. How could a pandemic end?
There are three fundamental ways one can easily think about.
1.We invent a vaccine: The best option. Smallpox, an infectious disease with a 30 percent risk of death, that killed an estimated number of 500 million over last 100 years of its existence before a successful vaccine was introduced by Edward Jenner, has now been fully eradicated since 1980. COVID-19 vaccine might come. Couples of hundreds of scientists are already working on it. But testing and application is another story. Time and resources necessary for bridging practical realities take away our hopes for an early solution. No harm trying though.
2.We (the majority of population) eventually achieve adequate immunity that prevents us from being infected: This is probably how we, humans, escaped most pandemics before. The virus makes the weak die while making the strong stronger so they will no more be infected. This, technically, is called ‘herd immunity’. It makes a community (the herd) immune to a disease, making the spread of disease from person to person unlikely. As a result, the whole community becomes protected, not just those who are immune.
3.We push social distancing to such an extreme, the spread naturally dies not finding new victims: If social distancing were perfect, the disease would have been over a period little more than two weeks – say 21 days. It spreads because somewhere somebody does not follow health precautions. We cannot make everyone behave ideally. Not in a practical world. Still social discipline narrows down opportunities for spread. That reduces the number of new cases. If the rate of spread were low enough, that could kill spread eventually. One hopes.

Fortunately for us, we do not have to treat these cases in isolation. They all can happen simultaneously, with one having positive impact on others.
There are other possibilities too. For example, #3 above now happens in virtually isolated communities from one another as international travel is restricted. In other words, we are socially separated as communities as well. Take Sri Lanka, for example. More than 20 million population is in a virtually COVID-19-free enclave. All active cases are already quarantined. Movements, in and out, are controlled. It’s a perfect enclave.
Now let’s consider this. If the entire world were segregated into such ‘local’ enclaves, eradicating the virus could be easier and faster. We have to maintain social distances only within them. In fact, within certain enclaves, the curve has already started taking the U-turn.
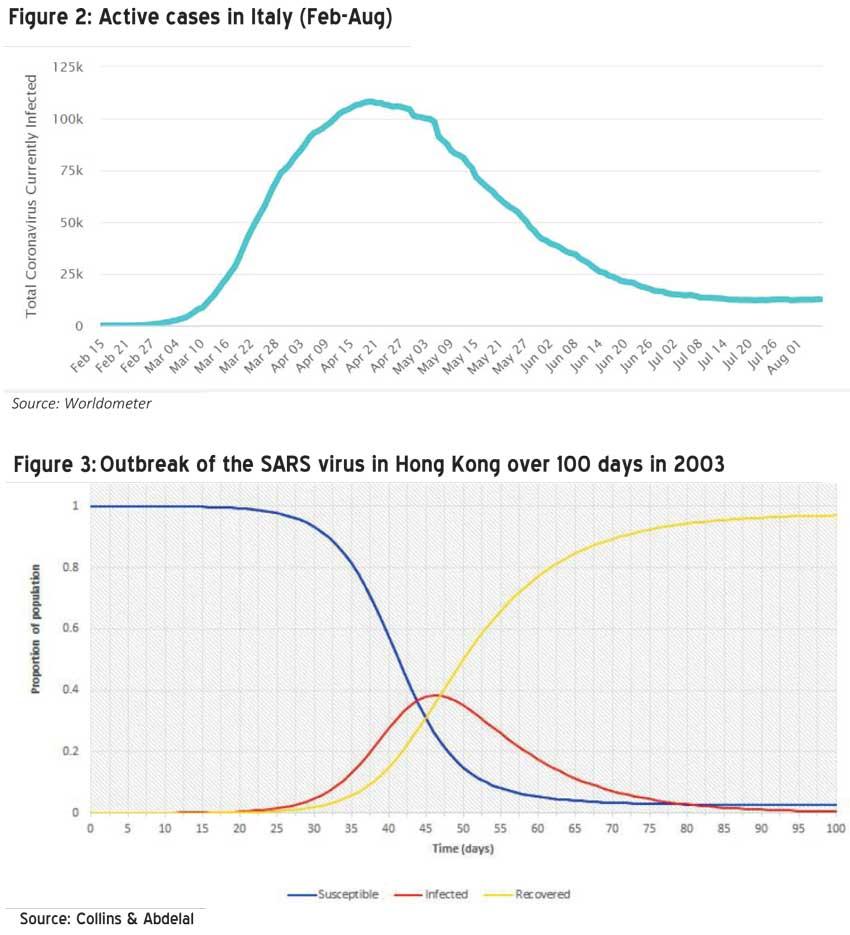
Really? Some prominent examples: Italy, where the spread was most severe once, is speedily recovering. Daily new cases in Italy have been seeing a sharp drop since April (Figure 1). For the first week of August, the new cases have dropped to about 250-300 on average per day. Active cases have dropped to 12,500, from 108,000 daily at its peak (Figure 2). Death rate, once nearly a 1,000 per day, is now a single digit. Similar recovery trends are seen once prominent United Kingdom (daily cases 700-800 from once 5,000+), Germany (daily cases 700-800) and France (daily cases about 1,000 a day).
Among the top five countries as of August first week, the United States shows a recovery but not as faster as examples above (also too early to be complacent, it can still turn back). Still it is early to say anything about Brazil. Russia and South Africa too are at their early stage of recovery, though they may take several months to reach the level of Italy. Only India shows a continuous growth.
Sri Lanka’s achievement is worthy a mention as the case is exemplary. As of first week of August, Sri Lanka’s place was 184th out of 213 countries in terms of cases reported per population (132/million). It was certainly far better than the countries otherwise upheld for their precautionary measures such as Nigeria (171st place with 215 cases/million), South Korea (159th place with 282 cases/million), New Zealand (154th place with 314 cases/million) and Japan (153rd with 315 cases/million). World average has been 2,408 cases per million.
Sri Lanka’s recovery (assuming no more waves) comes from approach #3 and notably from #2. Its strict quarantine measures were working. Interestingly, this could be the first successful recovery by that approach at international level, throughout human history. Full credit for taking such an innovative approach must go to the political leadership, COVID-19 and economic task forces, security forces and personnel, healthcare workers and all others who earnestly work towards achieving a pre-defined goal.

How fair is it to extrapolate isolated success stories such as Sri Lanka to mean a quick global recovery? Yes, that per se says little but there is more to the story. A look at previous recoveries may be pertinent.
The Spanish flu, also known as the 1918 flu pandemic, infected 500 million people – about a third of the world’s population at the time – in four successive waves. The death toll is typically estimated to have been somewhere between 17 million and 50 million, making it one of the deadliest pandemics in human history. How long did it last? Just 26 months from February 1918 to April 1920. Please note that was without a vaccine, certainly under poorer healthcare conditions and not following strict social distancing behaviour. Little information is available on what led to recovery. We can only assume it could be largely for the herd immunity.
Compared to that, we know more about the severe acute respiratory syndrome (SARS) pandemic of 2002. It was a disease with a relatively low transmission rate (estimated 0.36 in Hong Kong). Totally only 8,422 cases were reported with a case fatality rate (CFR) of 11 percent. It lasted only eight months.
The World Health Organisation declared SARS contained on July 5, 2003. The SIR model (Susceptible, Infected and Recovered of total population) for Hong Kong for 100 days showed how quickly the 7.4 million population changes from Susceptible to Recovered. (Figure 3)
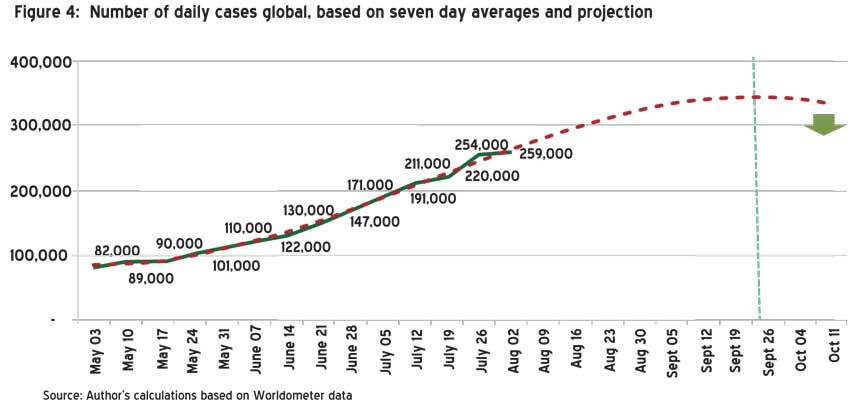
While it is too early for anybody to have data to plot similar graphs for COVID-19 recovery, one can certainly extrapolate the current global data to check the trend. Figure 4 shows seven- day daily new cases averages for weeks since early May. Mathematically, this figure is supposed to rise to somewhere around 350,000 before taking a U-turn late September. Sometimes, the peak may shift a bit towards November, depending upon the recovery rate. Definitely it cannot be too far. The trend line is the result of declining daily cases globally in July 19 and August 2 weeks.
Also, if we go further, three countries out of the top five (which account for 65-70 percent cases) are already on the recovery drive. India is the only country that the numbers still increase. It will continue to show the trend for a longer period but despite its size, it is still one country. (Figure 4)
So why June 2021? That is what statistics show. By the end of this year, recovery signs will be clear, almost everywhere – perhaps with few exceptions like India (and possibly Brazil). By March 2021, the new daily cases, on average, will be less than 20 percent of what it is today. By June 2021, it will be at near zero levels, unless India were not to recover. Long before that, the world will start working normal.
Finally, this will not be a miracle. This will be the outcome of science, technology, research and healthcare facilities coupled with correct political decisions. We have moved ahead from the conditions of early 20th century. We have recognised the importance of global decisions. Given the human advancement over the last century, what would be a surprise is we giving ourselves on the face of a global natural threat otherwise would have transformed to a disaster.
(Key references: Collins, Julia and Nadia Abdelal (2018). Spread of Disease, available at https://calculate.org.au/wp-content/uploads/sites/15/2018/10/spread-of-disease.pdf; Woldometer (2020). COVID-19 Coronavirus Pandemic https://www.worldometers.info/coronavirus/)
(Chanuka Wattegama, an academic and a policy researcher, can be reached at [email protected]. The views expressed here are personal)