24 Dec 2018 - {{hitsCtrl.values.hits}}


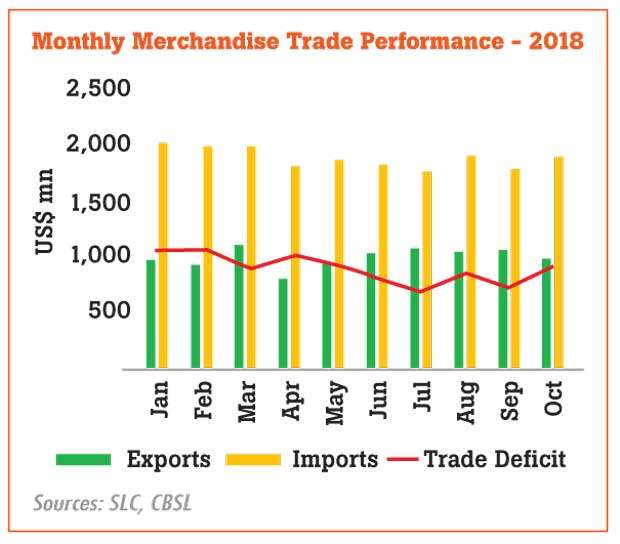
Sri Lanka’s trade deficit hit US $ 903 million in October expanding from US $ 752 million recorded in the same month in 2017, as the country’s import bill rose significantly compared to languishing exports.
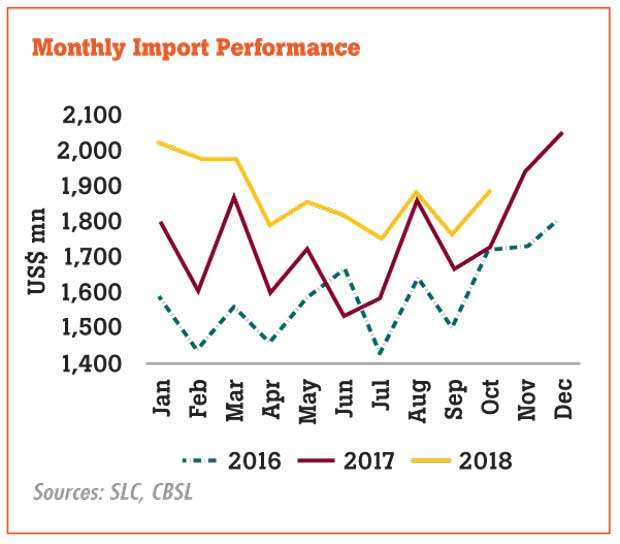
Sri Lanka imported US $ 1, 882 million worth of goods during October, up 9.0 percent from the same month in 2017, as the country spent a record high amount on personal vehicle imports.
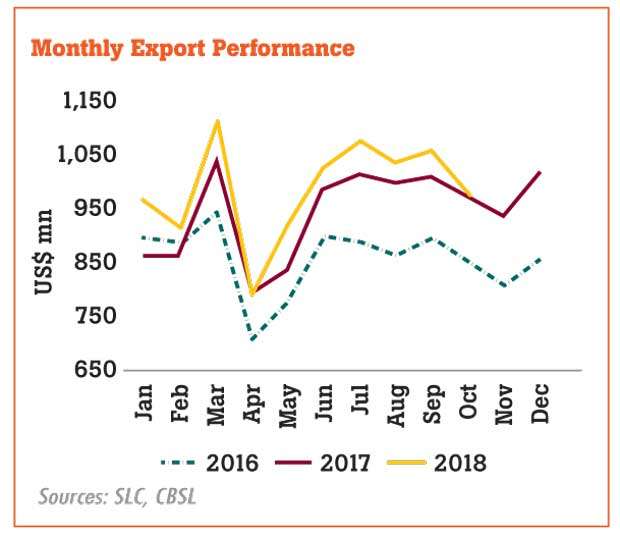
Sri Lanka’s exports continued to languish as earnings for the month rose just 0.4 percent year-on-year (YoY) to US $ 979 million while the 11.5 percent decline in agricultural sector exports offset the 4.5 percent increase in industrial exports.
This brought the cumulative trade deficit for the 10 months of this year to US $ 8,857 million, up from US $ 7,591 million recorded during the corresponding period last year.
“Sri Lanka’s external sector continued to be under pressure in October 2018. The trade deficit widened significantly in October due to a higher growth in import expenditure alongside a marginal growth in exports.
“However, it is expected that the trend of increasing imports will reduce in the coming months with the lagged impact of recently introduced restrictions on certain import categories,” Central Bank said.
An analysis of the country’s import basket shows food and beverage imports declining by 18.6 percent YoY to US $ 121.2 million in October, responding to the recent restrictions imposed on non-essential consumer good imports and the improvement in domestic production of some categories such as rice.
For instance, rice imports were just US $ 1.0 million in October compared to US $ 37 million in the same month last year.
However, what defies everything is the staggering amount of dollars going into the importation of personal vehicles.
People have spent US $ 161 million on personal vehicle imports in October compared to just US $ 55 million a year ago, registering a massive 193 percent growth despite the restrictions imposed by the government on vehicle imports.
The Central Bank said these were motorcars less than 1,500 cylinder capacity and hybrid and electric motor vehicles.
This is despite revising up the excise duties of those motor vehicle types in August and subsequently imposing financial restrictions on such in September.
During the 10 months, Sri Lankans spent a mind boggling US $ 1, 391 million on personal motorcar imports. Sri Lanka’s public transport system remains at a pathetic state and the capital city Colombo has one of the worse traffic jams in the whole of Asia. Meanwhile, Sri Lanka spent US $ 266 million on fuel imports—US $ 62 million on crude oil and US $ 201 million on refined petroleum in October, which together are up by 12.3 percent over the same month in 2017.
For the 10 months, Sri Lanka spent US $ 3,431 million on fuel imports, up 28 percent YoY.
However, the world fuel prices have declined close to 40 percent since the beginning of October due to oversupply fears on a slowdown in global growth and increase in supplies from the U.S. Meanwhile, the investment good imports, which include machinery and equipment and building material, rose by 8.5 percent YoY to US $ 426 million.
In the export front, agricultural sector exports suffered the most during October led by all categories except seafood, vegetable and rubber.
Earnings from tea exports dropped by 15.2 percent YoY to US $ 115.5 million with ten months earnings declining by 5.3 percent YoY to US $ 1.2 billion reflecting lower average export prices and volumes. Meanwhile textile exports, Sri Lanka’s largest industrial export category, rose by just 0.9 percent YoY to US $ 396 million due to lower demand from the U.S.
However this is despite the increase in exports to the EU market and non-traditional markets such as India, Canada, Japan and Hong Kong. For the ten months, textile and garment exports rose by 5.2 percent YoY to US $ 4, 354.5 million.
Further the food, beverage and tobacco exports also rose by 21.7 percent YoY to US $ 42.7 million.
16 Nov 2024 24 minute ago
16 Nov 2024 39 minute ago
16 Nov 2024 54 minute ago
16 Nov 2024 1 hours ago
16 Nov 2024 1 hours ago