Cost of production
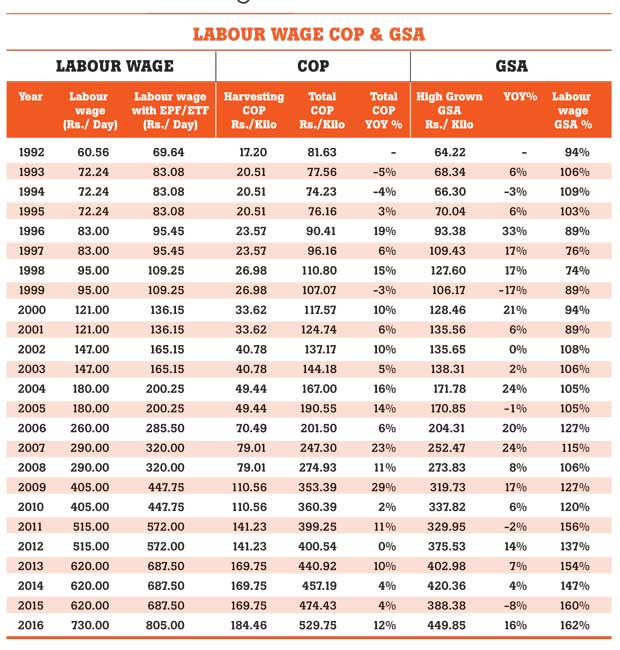
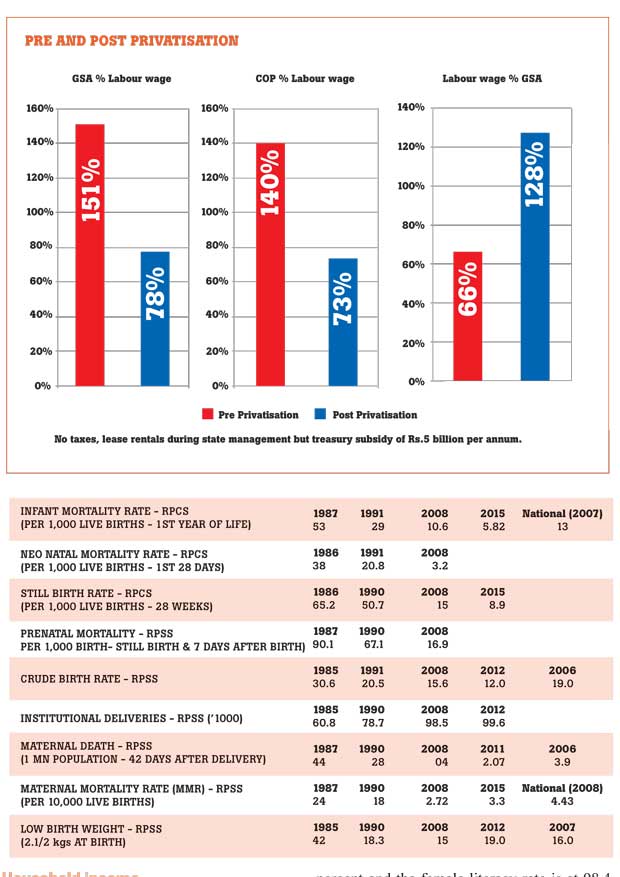
From 1980 to 1991, under state management, the average cost of production (COP) for a kilogramme of tea was 140 percent relative to the daily wage of a worker. After privatization, the regional plantation companies (RPCs) managed to contain the COP to 90 percent of the labour wage. If extrapolated under the ‘ceteris paribus’ conditions, the current COP should be in the region of Rs.1022.
However, the RPC COP is around Rs.530 at end-2016. Even in 1991, before the RPC takeover, the COP was Rs.61.58 per kilogramme and this was a 118 percent ratio of the then existing daily labour wage. If the present RPCs adopt this ratio that existed under state management, the COP should be in the region of Rs.861 per kilogramme.
From the official figures available from the Public Administration, Parliamentary Affairs and Plantation Industries Ministry, both the Janatha Estates Development Board (JEDB) and Sri Lanka State Plantations Corporation (SLSPC) made losses continuously from 1980, except for a few years.
Even in 1991, the loss per kilogramme of Rs.6.93 was equal to 13 percent of the daily labour wage although the net sale average (NSA) was 105 percent of the wage. On the same rate, the RPCs’ losses should be about Rs.95 per kilogramme but in spite of the NSA being as low as 62 percent now, instead of 105 percent of the labour wage, the RPC losses were very marginal.
VP extents and yield per hectare
The Vegetative propagation (VP) percentage in the JEDB was only 20.5 percent and for the SLSPC, it was only 17.2 percent by the time the estates were handed over to RPC management in 1992. The RPCs’ VP percent was at 56 percent in 2014, a very significant increase from the 19 percent the RPCs took over. The RPCs have replanted/new planted 24,575 hectares by 2014.
At the time the estates were handed over to the RPCs, although the JEDB had only 20.5 percent of its extent in VP, 12.4 percent was yielding between 1600-1800 kilogrammes yield per hectare (YPH), 4 percent at 1800-2000 kilogrammes YPH and only 2.5 percent above 2000 kilogrammes YPH.
For the SLSPC, with 17.2 percent VP, only 8 percent yielded between 1600-1800 kilogrammes YPH, 3 percent at 1800-2000 kilogrammes YPH and only 2 percent at 2000 kilogrammes and above. In contrast, by 2003 itself, according to the Tea Research Institute (TRI), the RPCs had 20 percent fields in up-country UC, 10 percent in mid-country (MC), 9 percent in low-country (LC) and 8 percent in Uva, yielding over 2500 kilogrammes YPH.
The writer has claimed there was a “statute” to replant 2 percent in VP. Then how was it that since the mid-1950s, when the VP was first introduced, for a period of close to 40 years (1955 – 1993), only 20 percent of the JEDB and 17 percent of the SLSPC extent was in VP tea, according to the Plantations Ministry Statistical Book, 1994.
According to the Report of the Commission of Inquiry on Agency Houses and Brokering Firms (1974), “All island rate of replanting” is 0.53 percent in 1965, 0.60 percent in 1966, 0.88 percent in 1967, 0.88 percent in 1968, 1.09 percent in 1969 and 1.05 percent in 1970. However, after privatization in 1992, the RPC annual rate of replanting within the 22 years to 2014 has already contributed to 67 percent of the existing replanted area.
In comparison, the tea smallholders with all the liberal state, institutional, organisational, technical, logistical, political and financial support have replanted/new planted only 30 percent of their existing VP extent (28,352 ha out of 109,780) for the same period.
In addition to the high percentage of tea planting, the RPCs have during the 14 years from 2000 to 2014, planted 51,657 hectares of new rubber, which is 108 percent of the existing mature and immature rubber extent of RPCs. This extent is only required to be covered in 30 years but the RPCs have done it within 14 years.
Compared to this, the rubber smallholders, once again with all the state patronage and largesse have replanted only 35,219 hectares out of 85,100 hectares, a measly 41 percent. Furthermore, since 1992, close to 20,000 hectares of fuel wood, 7,000 hectares of oil palm, substantial extents of commercial forestry, conservation forestry, community forestry, ornamental, fruit and export agriculture crops such as cinnamon, coffee, cardamom and cloves, etc. have been planted in all the RPCs.
National and international awards
The RPCs have regularly competed against all comers at national competitions and have won many national awards even beating some of the better established, financially prosperous larger organisations and multinational companies.
The RPCs have won Gold awards at National Green Awards, National Business Excellence in Agriculture, Excellence in Environmental Sustainability, Excellence in Corporate Governance, Excellence in Corporate Social Responsibility, Excellence in Performance Management, JASTECA Award for Corporate Social Responsibility, National Social Dialogue and Workplace Cooperation, National Occupational Health & Safety, SLITAD People Development Award and National HR Award and at international level, winning even the Asia Pacific Quality Work Life Award and Asia Pacific HRM Congress Award for Organisation with Innovative HR practices.
Global accreditation and certifications
Over 300 factories managed by the RPCs have more than 700 globally acclaimed certifications such as RA, FSC, GAP, ETP, UTZ, SAN, Fair Trade, ISO, HACCP, etc. The ‘Ceylon Tea Image’ and branding of ‘Food Factory Concept’, Chemical Free Tea, Cleanest Tea in the World, Zero Child Employment, Sustainable Agriculture, Environmental Management, Sustainable Agriculture Practices, Bio Diversity Conservation, Product Traceability to Origin and Single Estate Marks are all largely leveraged on RPC estates, management systems, services and facilities provided to its employees. Before 1992, there wasn’t even a single certification.
Quality of life improvements
Health indicators
Since privatization, under the RPC management from 1992, there have been very significant improvements to the quality of life and health indicators of workers. The infant mortality rate of 29 in 1991 came down to 9.4 by 2012. Neo natal mortality rate of 21 came down to 3.2. The stillbirth rate of 51 came down to 15 by 2008. Pre-natal mortality rate of 67 came down to 17 in 2008.
Institutional deliveries from 78 percent increased to 99.6 by 2012. There were only two maternal deaths for a population of one million in 2011, reduced from 28 in 1990. The maternal mortality rate of 18 in 1990 was brought down to 2.2 in 2008. MMR in RPC estates is lower even than the national rate of 3.3 in 2010 and many key health indicators are well above national averages.
Poverty head count
The poverty head count (PHC) for the estate sector, which was at 38.4 at the time of privatization, came down to 10.9 by 2013, according to the Household Income and Expenditure Survey (HIES) 2013. The PHC of the Nuwara Eliya District, with 62 percent of the district population as RPC population, is only 6.6, even below that of the national PHC of 6.7. Only nine districts such as Colombo, Gampaha, Kalutara, Kandy, Kurunegala, etc. are better than Nuwara Eliya.
The World Bank Group Poverty and Welfare in Sri Lanka Report (2016) states that around 40 percent of the national population subsists on less than twice the poverty line and of this eight million, the rural sector, accounted for 85 percent of poor – that is 6.8 million people, who account for 44 percent of the rural sector population.
The World Bank report however confirms that the surge in international prices of tea from 2006 to 2010 was passed on to the workers and between 2006 to 2009, only the real wages of the estate sector rose while rural and urban stayed flat and that real wages of estate workers continued to rise even more dramatically between 2009 and 2010.
Household income
Out of the total population of 706,600 people in the Nuwara Eliya District, 62 percent are the regional plantation sector population. The mean household income of the Nuwara Eliya District, with 62 percent of the district population as RPC population, is Rs.38,013, which is even above the national median household income of Rs.30,814 as per the HIES.
Only seven out of 25 districts in Sri Lanka have a better median household income than Nuwara Eliya. In the Mean Per Capita index too, only nine out of 25 districts are better off than the Nuwara Eliya District. According to the World Bank Group Report on Poverty and Welfare, the main pockets of poverty are in the Mullaitivu, Mannar, Kilinochchi, Batticaloa and Moneragala Districts. Not even one plantation district is in this list.
The report further states that the Colombo, Kandy, Galle, agglomeration, including the 60-kilometre buffer zone consisting of 70 percent of population, account for 55 percent of the poor.
Nuwara Eliya District
According to the HIES, the Nuwara Eliya District has a dietary energy consumption of 2,358 kilo calories, which is the highest in all 25 districts in our country, while the national average is only 2111 kilo calories. According to the Millennium Development Goals Country Report 2014, the proportion of national population below minimum level of dietary energy is 48 percent.
The Nuwara Eliya District’s employed people below the poverty line is 4.6 and only five districts in the country are better off. The maternal mortality rate of 1.9 per 10,000 live births is only bettered by one district (Kandy) for the whole country and even in underweight children; only 12 districts are better off. 78.2 percent of the population have drinking water within the premises; drinking water sufficiency is at 90.6 percent.
The net enrolment in primary education is at 100 percent and the male literacy rate is at 97.5 percent and the female literacy rate is at 98.4 percent. 83.1 percent have exclusive toilets for the households. 83.1 percent have telephones, 73.7 percent have radios, 82.2 percent have TVs, 46.4 percent have VCD/DVDs 23.3 percent have refrigerators and 40.1 percent have gas cookers. All these improvements to their economic and social status and well-being are because of the RPC employment provided to the workers.
The writer has claimed in one of his articles that advocating a different wage model with the consensual agreement of all the RPCs and other related stakeholders is ‘a fierce propaganda by anti-Sri Lankans who are in concert with the agendas by political giants in the Indian Ocean, who are competing with us’.
This is indeed a slimy and a profane charge. Such an accusation is an anathema for all the planters whose life’s labour was to protect and prosper the industry and to say such a vile thing is to sink so low in honour. It is famously said that “patriotism is the last refuge of the scoundrel”.
Some regard the RPC management as a predatory tiger to be shot, others look on it as a cow they can milk to exhaustion; but the real tragedy is that not enough people see it as a healthy horse, pulling a sturdy wagon. This writer once so grandly claimed in one of his articles that the fish starts rotting from the head and that has relevance to RPC CEOs and we can only say that only an experienced fishmonger would know the exact place a fish rots from.
Being the object of this writer’s unmitigated jealous, envious, slanderous and defamatory criticism is like being hit with an utterly spoilt cream puff; we are uninjured but sickened.
(Roshan Rajadurai is Managing Director of Hayleys Plantations Sector (Kelani Valley Plantations PLC/Talawakelle Tea Estates PLC/Horana Plantations PLC) and also a former Chairman of Planters’ Association of Ceylon)


