10 Jul 2020 - {{hitsCtrl.values.hits}}
 The Sri Lankan economy is in dire straits owing to the strict lockdown imposed by the government from March 21st to May 9th to counter the Covid-19 pandemic.
The curfew was partially relaxed on May 10th and lifted on June 29th. As a consequence of this lockdown, gross domestic product (GDP) has plummeted and consumer demand has been severely dampened.
Moreover, dwindling foreign reserves have forced the government to ban or restrict hundreds of import items and raise import duties on a wide range of other goods.

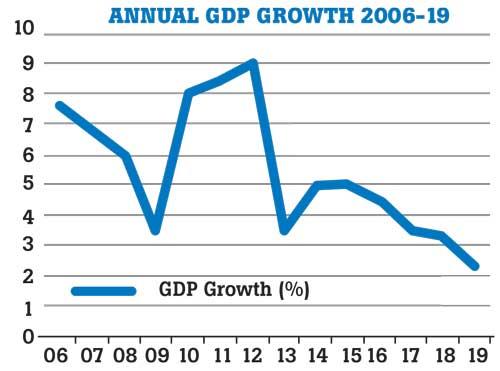
Other issues, such as falling exports, declining worker remittances, and mounting pressure of external debt-service obligations, are further exacerbating the problem of prudent macroeconomic management, especially in respect of preventing the precipitous decline of external reserves to a crisis level. With a severe balance of payments crisis hanging over the country like the sword of Damocles, the need to substantially increase net exportsand foreign direct investment (FDI) inflows over the medium term becomes imperative.It is clear from the line graph below that the economy was already in decline before the Corona virus hit. Whether it is capable of a rapid and competent recovery remains to be seen, given the poor growth performance in recent years.
The objective of this article is not to construct a hypothetical post-Covid-19 scenario but rather to undertake a brief, pre-Covid-19 assessment of the economy. Due to recent publication of the 2019 Central Bank Annual Report, it is now possible to determine how the Sri Lankan economy performed during the previous decade (2010-19). For convenience this timeline is divided into two, adjacent, five-year blocs: 2010-14 (MR regime) and 2015-2019 (MS regime). Since spatial constraintsdo not permit a detailed review, focus is on selected macroeconomic indicators.
Growth performance from 2010 to 2014
The MR regime governed the country from 2006 to 2014. As per the line graph, from 2006 to 2009, GDP growth underwent a gradual decline. After the civil war ended in May 2009, political stability was restored; tourism, exports, and workers’ remittances picked up; and under-utilized land and labor resources in the North and East came into play. Consequently, the economy realized an impressive growth spurt, as reflected in annual GDP growth rates of 8 percent, 8.4 percent, and 9.1 percent over the three year period 2010-12.

But, despite the government adopting an expansionary fiscal policy to finance an array of productive as well as unproductive infrastructure projects, this rapid growth trajectory was not sustainable due to the ad-hoc nature of policy formulation, the lack of an investment-friendly policy climate, a rising external debt-service ratio, and poor macroeconomic management on the whole. The GDP growth rate plummeted to 3.4 percent in 2013 and increased modestly to 5 percent in 2014 (as per revised estimates by the Central Bank).
Average GDP growth for the period 2010-14 was 6.8 percent per annum with little evidence of structural reform. Had there been structural change, the economy would have moved to a higher growth trajectory on a sustained basis.
By and large, failure of the MR regime to restructure the economy resulted from its reluctance to adopt a sound macroeconomic policy framework and to maintain the external debt overhang at a manageable level through prudent borrowing.
Poor macroeconomic management is reflected in the fact that between 2010 and 2014 the external debt to GDP ratio grew from 37.8 percent to 54.1 percent and the external trade deficit, from US$ 4.8 to US$ 8.3 billion. Due to the failure of the economy to register strong export-led growth, the currency depreciated from Rs. 111 to 131 per US dollar.
Though FDI inflows increased from US$ 478 to US$ 894 million, the overall level was too low to spur economic growth. Gross official reserves (GOR) rose from US$ 7.2 billion to US$ 8.2 billion largely due to an increase in commercial borrowing. On the positive side, the MR regime was able to reduce the annual inflation rate from 6.2 percent to 3.3 percent and the fiscal deficit to GDP ratio, from 7.0 percent to 5.7 percent during the above time frame.
Growth performance from 2015 to 2019
The so-called Yahapalanaya government was probably the most ineffective coalition to rule the country since Independence. Like a ship without a rudder, it drifted aimlessly in the sea of realpolitikfor almost five years before suffering a humiliating defeat at the November 2019 Presidential Election.
Due to weak macroeconomic management, political indecisiveness, internal bickering, and lack of direction and leadership at the top, GDP growth declined steeply from 5 percent in 2015 to 2.3 percent in 2019. (No doubt the Easter bombings of 2019 dealt a severe blow to tourism and potential FDI inflows.)
Average GDP growth for the above period was 3.7 percent per annum compared with 6.8 percent under the previous regime. Not since the latter half of the 1980s, when the country was fighting a war on two fronts, did the economy perform so poorly. Average GDP growth during this period (1985-89) was 3.2 percent per annum.
We should note that recently the World Bank downgraded Sri Lanka from an upper-middle income to a lower-middle income country due to gross national income per capita slipping below the upper-middle income threshold of US$ 4,046 in 2019.
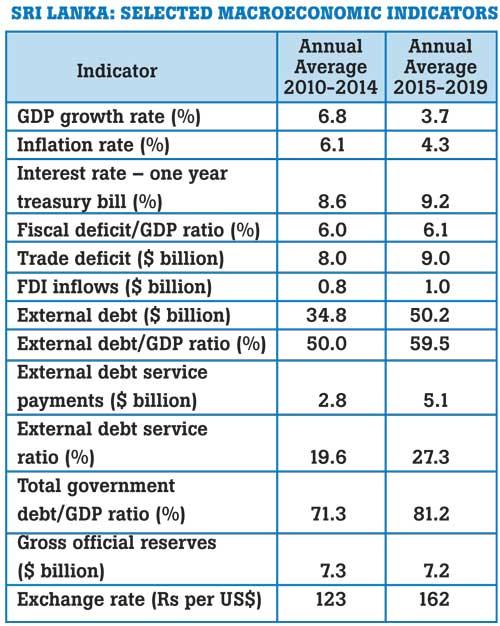
As the table below shows, the MR regime outperformed the MS regime in respect of several key macroeconomic indicators, such as the average GDP growth rate, the average interest rate, the average external trade deficit, the average external debt to GDP ratio, the average external debt, the average debt service ratio, the average total government debt to GDP ratio, and the average exchange rate.
In only two areas, namely the average inflation rate and average FDI inflows, did the MS regime manage to outperform the MR regime.As per the average fiscal deficit to GDP ratio and average GOR, the two regimes produced almost identical results which, from the point of view of sound macroeconomic management, were far from satisfactory.
It should be noted that in respect of external debt servicing, a significant proportion of the MS regime’s amortization and interest payments pertained to commercial loans procured by the previous regime. This partly explains why average, annual debt service payments were much higher under the MS regime than under the MR regime (US$ 5.1 billion versus US$ 2.8 billion). But this did not deter the MS regime from going in for heavy commercial borrowing as well.
External debt sustainability has become a major issue due to imprudent commercial borrowing by both regimes. It will be interesting to see what strategy the present government will adopt to meet its debt service obligations in 2020 given the severity of the economic downturn caused by the Corona virus shock.
According to Moody’s, “external debt servicing is estimated at around US$ 3.8 billion from June to December, including a US$ 1 billion international sovereign bond (ISB) payment in October” (Mirror Business, July 07, 2020). It will be observed in this regard that GOR declined from US$ 7.6 billion at the end of 2019 to around US$ 6.5 billion in March this year.
Conclusion
Though the economy by and large fared far better under the MR regime than under the MS regime, it did not live up to expectations. This is reflected in the fact that average, annual GDP growth rate during the period 2010-15 (6.8 percent) was not substantially higher than that for the period 2006-09 (6 percent), when the war was raging in the North and East.
The bottom line is that GDP growth on the whole has been following a declining trend since 2012, when it registered over 9 percent growth. The prospect of negative GDP growth in 2020 looms large for Sri Lanka as well as several other countries affected by the Corona virus pandemic.
(The author is a retired economist/international consultant to ADB, Manila)
25 Dec 2024 2 hours ago
25 Dec 2024 3 hours ago
25 Dec 2024 4 hours ago
25 Dec 2024 4 hours ago
25 Dec 2024 5 hours ago