29 Aug 2019 - {{hitsCtrl.values.hits}}

By Ceylon Tea Brokers PLC
The second quarter of the Sri Lanka’s tea industry in 2019 saw a sharp decline in elevation averages in comparison to the first quarter.
Increased crop figures and decline in quality, political tension in the Middle East, contributed towards the downward spiral of prices in quarter two. Whilst the global tea supply increased in the first half of 2019, Sri Lankan tea exports increased marginally in comparison to the same period last year.
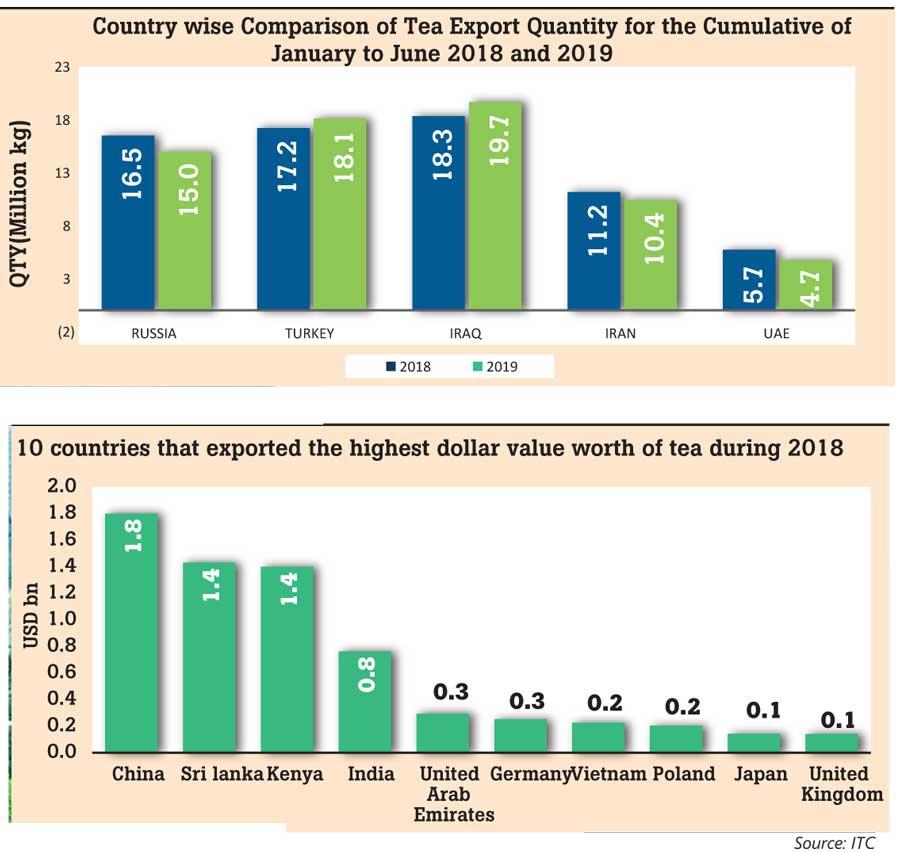
Iraq, turkey and Russia continued with strong demand for Sri Lankan tea and were the top 03 importers in the first six months concluded.
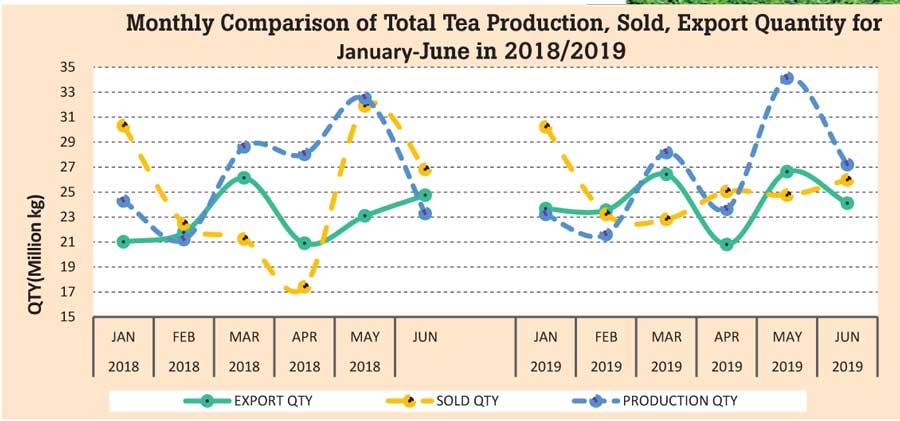
The Total Sri Lanka Tea Production for January - June 2019 recorded 158.47 Mn Kgs in comparison to 158.15 Mn Kgs (+ 0.31Mn Kgs) for the same period last year. Production has increased by 0.31 Mn Kgs and Exports have increased by 7.56 Mn Kgs compared to the same period in 2018.

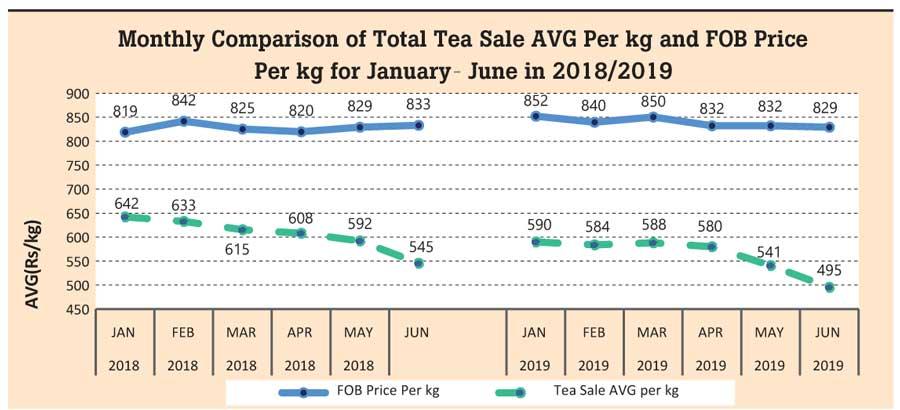
The total national average of the teas sold for the period January to June 2019 was Rs.561.14 (US $3.16) in comparison to Rs.603.52 (US $.3.86) for the same period last year. Low Growns averaged Rs.588.98 (US $3.31); Mid Growns recorded Rs.490.37 (US $2.76) with High Growns at Rs.534.54 (US $3.01). The averages for High, Medium and Low Growns in rupee and dollar terms, shows a decrease (-Rs.42.38) (-US $0.7) for the period January – June 2019 when compared to the same period in years 2018. Low Growns with the largest market share with 62.15 percent of the production recorded a decrease of (-Rs.39.19) whilst High and Medium Growns recorded a decrease of (-Rs.40.90) and (-Rs.52.73) respectively when compared to the corresponding period in the year 2018.
Sri Lanka’s tea exports for the period January-June 2019 amounted to 145.14Mn Kgs vis-à-vis 137.59Mn Kgs recorded for the same period last year (+7.56Mn Kgs). The FOB average price per Kilo for this period stood at Rs.839.46 as against Rs.828.13 recorded for the same period last year. (+Rs.11.33)

The total revenue realized for the period January - June from Tea Exports was Rs.121.84 billion (US $0.69 billion) compared with Rs.113.94 billion (US $0.71Bn) recorded last year. It’s an increase in Rupee terms (+Rs. 7.9 billion) and a decrease in Dollar value (-US $ 0.02 billion) compared to the year 2018.
Iraq has emerged as the largest buyer of Sri Lankan tea in the period of January-June 2019. Turkey and Russia records as the second and third largest importers of Sri Lankan tea for the mentioned period.
World economic outlook
Global growth remains subdued, the united states further increased tariffs on certain Chinese imports and China retaliated by raising tariffs on a subset of US imports. Global technology supply chains were threatened by prospect of US sanctions, Brexit related uncertainty continued and raising geopolitical tensions roiled energy prices against this backdrop. Global growth is forecasted at 3.2 percent in 2019 picking up 3.5 percent in 2020.
United States
Growth is expected to be 2.6 percent moderating to 1.9 percent in 2020. Domestic demand was somewhat softer than expected and imports weak in part reflecting effects on tariffs.
Euro area
Growth is projected to be 1.3 percent in 2019 and 1.6 percent in 2020. Forecast for 2019 is revised down. Euro area growth is expected to pick up over the remainder of this year and into 2020.
Japan
Japan’s economy is expected to grow 0.9 percent in 2019.

Middle East and North Africa
The forecast for 2019 is 0.5 percent points lower than in April, largely due to downward revision of forecast for Iran (owing to crippling effect of tighter US sanctions). Political instability across other economies added to the difficult outlook for the region.
CIS & Russia
Activities in CIS are projected to grow at 1.9 percent in 2019, picking up to 2.4 percent in 2020. A downward outlook is reflected on Russia following a weaker first quarter.
Downside risks have intensified since April 2019, this includes escalating trade technology tensions, geopolitical tensions and mounting disinflationary pressures that make adverse shocks more persistent.
Global sales from tea exports by country totaled an estimated US $ 7.76 billion in 2018. The value of worldwide tea exports fell by an average -0.5 percent for all exporting countries since 2014 when tea shipments were valued at US $ 7.8 billion. Among continents, Asian countries sold the highest dollar worth of exported tea during 2018 with shipments valued at US $ 4.7 billion or 60 percent of the global total. In the second place were African exporters at 23 percent while 13.2 percent of overall tea shipments originated from Europe.
Major tea producing countries are currently witnessing healthy production levels whilst seasonally prices are expected to move up on short term in the next few months due to anticipated demand from the European sector. US sanctions against Iran, Political instability in the Middle East and Trade Wars could have an adverse effect on the price structure of the tea industry.
23 Nov 2024 23 Nov 2024
23 Nov 2024 23 Nov 2024
23 Nov 2024 23 Nov 2024
23 Nov 2024 23 Nov 2024
23 Nov 2024 23 Nov 2024