Rubber industry analysts have said some time ago that, natural rubber (NR) prices are likely to take a dip after 2012 due to the acceleration in normal production on account of massive new planting undertaken across the major natural producing countries of the world during 2005-08. This effect, however, will taper off after 2020.
Post 2011 trends
An analysis of the production-consumption scenario leading to higher prices of NR in 2011, showed that the extremely high growth in consumption in 2010 (15.3 per cent) and low growth in normal production (2.5 per cent) led to very low stocks at the end of 2010, too little to cover seasonal production lows of early 2011.This is exactly what led to the very high prices in early 2011.
The 2011 growth in consumption was 6.3 per cent with relatively low growth in normal production (3.5 per cent). In the event of a scenario of higher growth in total rubber consumption in 2012, it will have a strong effect during 2012-13 because of the relatively tight market, which would then continue into 2013. On the other hand, a lower world-wide production, a reduction of 1 per cent, will also have a strong effect on prices during 2012-13.
Global NR normal production is estimated to reach 17.7 million tonnes by 2025. Global NR consumption is estimated to touch 11.40 million tonnes in 2012 from 10.92 million tonnes in 2011 registering a 4.4 percent growth.
Consumption
Rubber consumption for the tyre sector is related to tyre production via tyre weights by major types of tyres. The remainder of rubber consumption is for general rubber goods (GRGs).
According to estimates, out of the global rubber consumption of 36.7 million tonnes (NR+SR) in 2020, tyres will account for 22.5 million tonnes and GRGs 14.2 million tonnes
Close to 60 percent of all rubber used in the tyre industry while the balance is used for general rubber goods.
New planting
In respect of new planting, during the year 2010 alone, Vietnam topped the list with 75,000 ha, followed by China (58,000 ha) and Laos (55,000 ha).
Outlook
Natural rubber market is likely to remain highly volatile considering the present situation. Apart from demand- supply relations, the natural rubber (NR) price is influenced by many factors such as weather, currency exchange rates, oil prices, policy changes in major countries and speculative.
Domestic rubber production declined by 3.9 per cent to 152 mn kg in 2012 over the previous year.
This was mainly a result of the reduction in tapping days due to torrential rainfall and the decline in natural rubber prices from the highest ever prices recorded in 2010 and 2011.
The two largest contributors to total rubber production, Sheet Rubber and Latex Crepe Rubber, declined by around 2.4 per cent and 39 per cent to 59.2 mn kg and 36.6 mn kg, respectively.
Lower rubber prices affected the better agriculture practices of rubber smallholders adversely, thereby affecting yield despite the fertilizer support programme. As a result, the yield in rubber declined to 1,459 kg per hectare in 2012 from 1,566 kg per hectare in 2011.
Domestic consumption of natural rubber in Sri Lanka declined by 1.5 per cent to 110.04 mn kg in 2012 primarily due to contraction in demand from industries catering to the export market where Latex Crepe is used as one of the main inputs for high end products.
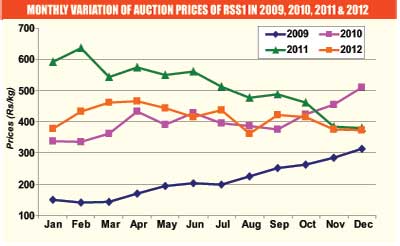
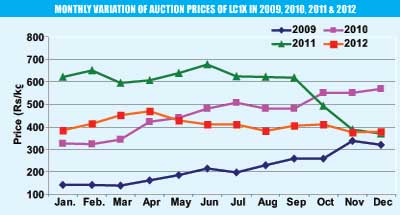
The average prices of different rubber varieties declined in 2012 compared to record prices earned in 2011 ( see figure 1 & 2). The subdued demand from major tyre manufacturing markets in East Asia, improved rubber production in other rubber producing countries and the build up of carryover stocks in the international market contributed to the decline in natural rubber prices.
The average prices of both Ribbed Smoked Sheet 1 (RSS1) and Latex Crepe IX declined at the Colombo Rubber Auction by 19 per cent to Rs.417 per kg and 29 per cent to Rs.411 per kg, respectively, in 2012 compared to 2011. During this period, export prices of RSS1 and Latex Crepe IX also declined by 24 per cent and 23 per cent to Rs.447 per kg and Rs.407 per kg, respectively. In 2013, this declining trend, it appears, will continue.
Fluctuations in commodity prices
Sharp fluctuations in commodity prices, which are not unique to rubber (See figures 1 & 2), are creating significant business challenges that can affect virtually everything from production costs and product pricing to earnings and credit availability.
This extreme price volatility makes it hard to run a business and to plan and invest for the future. It can also undermine a company’s profitability and competitiveness, and in some cases it can even threaten a company’s survival.
Historical price behaviour
Rapid and extreme price increases have occurred in several commodities over the past 15 years. During this period`, a number of commodity groups — including energy (crude oil, natural gas), metals (copper, aluminum), industrials (rubber, cotton), and food (corn, coffee) — experienced sharp price increases of 30 percent to 60 percent over periods of three to six months. This is partly a result of strong growth in demand, coupled with the effects of globalization, which tend to amplify the speed and magnitude of price shocks.
Companies that are major consumers of such commodities often think there is nothing they can do about these extreme short-term price shocks. In fact, we would argue that companies that don’t actively manage extreme commodity price volatility are essentially taking a “short” position — a commitment to buy the commodity at whatever price the market determines — which is equivalent to betting that prices will not rise. In other words, even if you do nothing, you are still committing to a course of action — whether you intend to or not.