06 Nov 2017 - {{hitsCtrl.values.hits}}

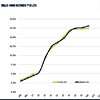
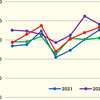
 The Colombo Stock Exchange has experienced considerable growth during the last few months. However, the market recorded short-term fluctuations in the short run (Table). A successful investor will invest with a long-term perspective to avoid the fluctuations experienced in the short run.
Successful trading – investing with the intention of holding a security for one year or more – means paying attention to the big picture, even when a grim short-term outlook sends investors running for the exits. In other words, buy-and-hold investing (buy and hold is a passive investment strategy in which an investor buys stocks and holds them for a long period of time, regardless of fluctuations in the market) requires focus, patience and, most importantly, discipline.
In order to succeed, investors must avoid getting caught up in violent market swings or other short-term influences and invest in stocks that they feel comfortable holding for the long term. Let’s take a look at how to find these stocks using both fundamental (fundamental analysis is a method of evaluating a security in an attempt to measure its intrinsic value, by examining related economic, financial and other qualitative and quantitative factors and contrarian (contrarian is an investment style that goes against the prevailing market trends by buying poorly performing assets and then selling when they perform well) indicators.
Fundamental indicators
Fundamental indicators are among the key tools used in long-term trading. Fundamental analysis is one way to determine whether a stock is undervalued or overvalued. It involves looking at a company’s earnings, cash flow and other financial benchmarks in relation to its industry and to the overall stock market, its historic growth and future growth potential, among other factors.
Good fundamental indicators
Many good indicators can help you determine whether a stock is a good long-term buy. These include:
Price/earnings ratio
A price earnings (P/E) ratio is calculated by dividing the price of the stock by the earnings per share (EPS). A company that has a higher P/E ratio compared to its competitors or the industry could mean that investors are paying more for every rupee of earnings, which suggests that the stock is overvalued. A lower number compared to the company’s competitors or industry might signal that the stock is undervalued.
For example, if ABC company has a P/E ratio of eight while the industry has a P/E ratio of 12, this suggests that ABC’s stock is relatively less expensive compared to its earnings. Conversely, if DEF is trading at a P/E ratio of 15 while the industry has a P/E ratio of 11, this would indicate that DEF investors are paying more for every rupee of earnings.
However, these numbers should be considered along with other factors. Some companies or industries that are growing rapidly, for example, will tend to have higher P/E ratios due to their higher growth rates. Similarly, during times when the economy is expanding, a high P/E ratio may be acceptable for some types of stocks, particularly those in high-growth industries such as technology. When earnings are contracting, however, a high P/E ratio could signal an overvalued stock.
Book value
The book value is another way to determine whether a stock is over- or underpriced. Basically, book value represents what a company would be worth if it stopped doing business tomorrow and were liquidated. The price-to-book ratio is calculated by dividing the current price of the stock by the latest quarter’s book value per share. If a stock is selling far below its book value per share, it might be undervalued. Conversely, a stock priced above its book value could be overpriced.
For example, if HIG company has a book value of Rs.20.93 and is trading at Rs.10, the stock could be undervalued. However, if QRS has a book value of Rs.30.95 and the stock is trading at Rs.64, this may signal that the stock is overvalued. As with any fundamental indicator, the book value must be considered in conjunction with other indicators. It is also more meaningful when used to analyse stocks in certain industries compared to others. For example, the stock of a rapidly growing company could trade well above the book value and still represent a good buy in some industries.
Cash flow vs. debt
Cash flow is the amount of money that is moving in and out of a business. Operating cash flow is revenue less operating expenses, including adjustments to net income. Cash flow is a good indicator of a company’s financial health because it is more difficult for companies to manipulate than earnings. As such, some investors prefer it as an analytical tool.
Debt is the total amount that is owed by a company, including bonds and outstanding loans. While debt can finance growth during times of prosperity, it can also become a burden if a company is having financial difficulties. A company’s debt obligations should be manageable in relation to its cash flow.
Contrarian indicators
Contrarians believe that the crowd is always wrong, and that when everyone is overwhelmingly optimistic, it is time to sell stocks and take profits or to focus purchases in neglected corners of the market. On the other hand, contrarians believe investor pessimism presents opportunities to purchase overlooked stocks at low valuations.
The key is to wait until everyone feels certain about something and then do the opposite. Successful outcomes can sometimes take a year or more to develop, so the strategy requires patience. Contrarian indicators such as those below should be used with other tools to spot good long-term buys.
Short interest
Short interest is the number of shares sold short that have not been repurchased. This is a good contrarian indicator because it shows how pessimistic investors are about a particular stock. It can be a useful tool in long-term trading, as steadily rising short interest could be a sign that the stock is becoming undervalued due to excessive fear. When using this indicator, look at the short interest ratio to gauge investor pessimism. The higher it is, the more pessimistic investors are about the stock.
Bottom line
Successful long-term trading requires that you have a time horizon of one year or more and be willing to focus on the big picture. Investors can use fundamental indicators, such as the price-earnings ratio, book value, cash flow and debt, to determine whether a company is financially sound and if its stock is trading at an attractive price.
Contrarian indicators, such as short interest, can gauge how optimistic or pessimistic investors are, and can be used in conjunction with fundamental indicators to find a good long-term buy.
29 Dec 2024 57 minute ago
29 Dec 2024 1 hours ago
29 Dec 2024 2 hours ago
29 Dec 2024 2 hours ago
29 Dec 2024 5 hours ago