27 Jun 2024 - {{hitsCtrl.values.hits}}
| Hosts need to make long-term commitments to keep operating their devices and perform any maintenance |
 Fine particle pollution monitor operated by the US Embassy in Colombo 07 remains the only long-term data source (7 years and counting), and the only one that makes data publicly available in near-real-time for free”
 In November 2022, Verité Research wrote on the importance of better data to formulate a necessary air quality policy in Sri Lanka (https://www.veriteresearch.org/wp-content/uploads/2022/11/20230425_AQD02_AirQualityandPublicHealth_F.pdf). The author recently worked with Verité Research staff to audit the air quality data that had since become available from around Sri Lanka, and concluded that there still wasn’t enough data to base any firm policy conclusions on. Despite some recent steps in the right direction (see https://airquality.lk, for instance), coverage and completeness of air quality monitoring, data in Sri Lanka is spotty at best. This is due to a lack of trained staff to maintain and operate monitors and a lack of funds to replace failed equipment resulting in long data gaps. The usual factors that plague developing nations.
While the Central Environmental Authority (CEA) operates two advanced air quality monitoring stations in Battaramulla and Kandy, timely and transparent data sharing with the public is clearly not one of their priorities. Several low-cost sensors have been deployed around Sri Lanka by the National Building Research Organisation (NBRO). But the fine particle pollution monitor operated by the US Embassy in Colombo 07 remains the only long-term data source (7 years and counting), and the only one that makes data publicly available in near-real-time for free.
Where do we go from here? I’d like to propose a three-pronged strategy:
1. Keep doing our best to keep a decent monitoring network operating long term
Airquality.lk has made a good effort to serve as a collection point which performs necessary quality control, calibration and archiving. This portal also acquires data from PurpleAir brand sensors. These efforts need to be sustained and expanded by adding more sensors in un-monitored parts of the country.
2. Support citizen scientists and organisations setup their own sensor devices
This is not about robotics aficionados buying some equipment online, soldering together a gizmo in their garages and hanging them on trees to collect data. There are lots of considerations with equipment calibration, data telemetry, and monitoring site selection (location must not be unduly influenced by a localised pollution source that is not representative of the general area). Lots of guidance and support are available at https://www.epa.gov/air-sensor-toolbox/guide-siting-and-installing-air-sensors.
Very importantly, operators must transmit their data to online portals that perform some of the quality control and calibration steps in the cloud, in near-real-time. Hosts need to make long-term commitments to keep operating their devices and perform any maintenance. At present, there are two brand names that offer off-the-shelf devices for under US$300 with the necessary functionality: PurpleAir and IQAir. Data collected with these devices are available to the public for free and are permanently archived.
3. Leverage satellite data to identify pollution hotspots and trends around the country
There are several satellites monitoring air pollutants worldwide daily, and making the data available free online. Though these may look like daily satellite pictures shown on weather sites, each pixel represents a remotely-sensed measurement. Satellites can only detect pollutants throughout the entire depth of the atmosphere, not just those at ground level. Further, clouds interfere with their detection, so their data doesn’t correspond 1:1 with ground- based monitors. But because of their excellent spatial coverage and archives going back several years, they can be used to make relative comparisons between different areas, track long term trends in the same area and further investigate unexpected hotspots. Thanks to several online data processing tools, wrestling down large satellite data files doesn’t require massive amounts of computing power or disk space.
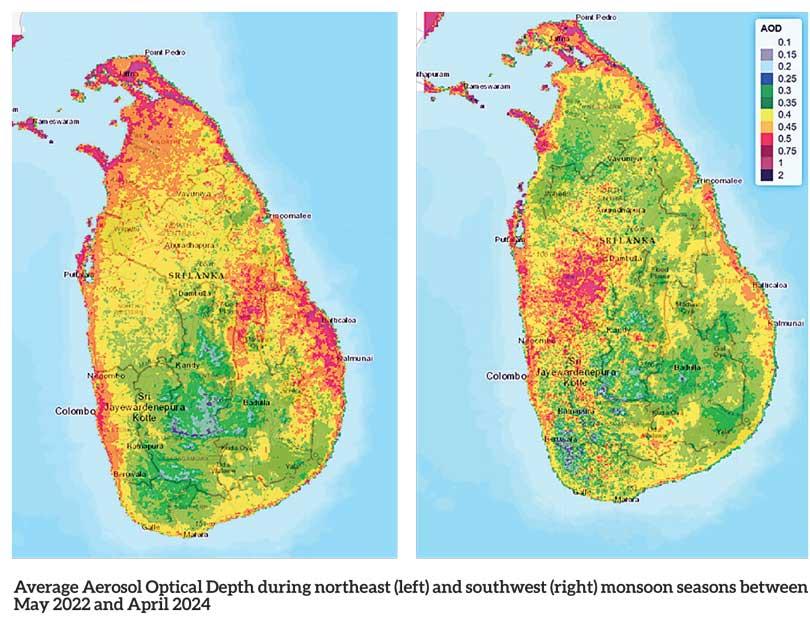
Here is a comparison of atmospheric aerosols (known as the Aerosol Optical Depth, or AOD) over each major monsoonal season, averaged over two successive years. Use the colours as a relative measure and not to determine if a particular area is safe or not. Notice more blue and green areas implying comparatively lower pollution during the southwest monsoon. During the northeast monsoon, pollution is transported from regional countries, but meteorological factors that confine locally-generated pollutants to a shallower layer also degrade air quality. Further, notice how a patch of red moves to the northeast and northwest of the central hills in each season. Is this a hotspot caused by pollutants damming up on either sides of the hills, depending on wind flow?
Average Aerosol Optical Depth during northeast (left) and southwest (right) monsoon seasons between May 2022 and April 2024. Images created by the author using MAIAC data available on Google Earth Engine (https://doi.org/10.5067/MODIS/MCD19A2.061).
I am not making a case for “analysis-paralysis” by monitoring and analysing forever before we act on the data. Because of year-to-year variability in pollutant emissions and meteorological patterns, several years of reliable data are needed to establish robust trends. We need to use all the resources at our disposal and obtain those data first.
Dr. Ranil Dhammapala is a Research Fellow at Verité Research and the Senior Meteorologist at South Coast Air Quality Management District, California, USA.
24 Nov 2024 3 hours ago
24 Nov 2024 6 hours ago
24 Nov 2024 6 hours ago
24 Nov 2024 7 hours ago